Benoîte Yver
  • Home
  • Solutions
  • FOR START-UPs
  • Portfolio
  • Blog
  • Contact

Interviewing for a  Head of Demand Generation? Top Questions to Land Top Talent

5/14/2015

0 Comments

 
Picture
A few weeks ago, I sat down with an executive recruiter who asked me if he could pick my brain on how I would go about interviewing a ‘Head of Demand Generation’. Perhaps you are also on the market for top B2B marketing leaders. If so, I thought I would share what I discussed with him and the right questions to ensure you’ll hire the best talent.

Before I jump into a list of interview questions that I believe can help assess the competencies of a Demand Gen marketer, I’d like to preface with some general thoughts on what Demand Generation is. Many people think of Demand Generation as a sub-function within B2B marketing and relegate it to a sub-team within the marketing organization. But, in actuality, Demand Gen is B2B marketing.

The new terms “Demand Gen.”, “Revenue Marketing”, “Demand Marketing”, “Lead Generation”, “Demand Creation” or “Growth Hacker” were coined to highlight the new imperative and expectations required of marketing campaigns and the corporate marketing team. Whereas marketing was traditionally seen as support function and cost center, its new mandate is now to drive growth and scale revenue. And this shift of marketing responsibility needed new language, hence the birth of all of these new titles.

So what does this mean for marketing teams and landing top talent? Whether a B2B marketer is working on defining the brand, the messaging, developing new sales collateral, doing a video shoot, creating content, organizing an event, talking with analysts, writing a press release, or planning a go-to-market strategy, in the end, all of these activities work toward the same goal: demand creation and sales pipeline generation. So if a company wants its marketing department to help drive sales, it needs to recruit marketers with a Demand Generation mindset.

In my experience, B2B marketers themselves understand the need to catch up with this new skillset; some embrace the change, some fear it, some put up with it, some hire ‘Demand Gen’ specialists to make up for the gap and some adapt this new mindset fully. You want to hire the latter.

In my opinion, the interview questions listed below apply as much to the CMO or VP marketing as to the head of demand generation or, in actuality, any B2B marketing leadership position.

MARKETING ANALYTICS

These questions are meant to gauge how in control the marketing leader is of his marketing funnel and his impact on the corporate growth.

  • Keeping it high level, can you describe the lead management process at your current company; how did you model the marketing funnel, what are its different stages, and how is the hand off to the sales team (field, inside sales, SDR etc.) ?
  • What’s the conversion rate from marketing/automated generated lead to opportunity/sales qualified lead? And where in your marketing funnel do you think there is opportunity for improvement?
  • Do you measure your marketing sourced pipeline? If so, how much of the pipeline is the marketing team generating a month, and what percent of the sales pipeline does this represent?
  • How much time does it takes on average for a marketing qualified lead to convert into an opportunity or sales qualified lead? How do you work with the sales team and inside sales team? How compliant are they with the SLA? What feedback do they have on the process?
  • What’s your cost per opportunity ?
  • How big is your marketing database? How many active contacts do you have?

CAMPAIGN DESIGN & EXECUTION

As you can see, these questions are meant to assess the marketing leader strategic thinking, and how he/she might translate the strategic vision into tactical execution day to day for you.
  • How do you think about campaigns? What’s your framework in developing campaigns? What are some the main/overarching campaigns running currently at your company?
(This question is meant to get a sense of the interviewee’s strategic and big picture thinking)
  • Can you describe your marketing campaign planning process?
(This question is meant to evaluate how the marketing leader might go from strategic to tactical, and execute his strategic vision)
  • How is your team at your current company organized and why?
  • How do you build your marketing budget and allocate marketing mix?
  • What are your target customer segments? 
  • How do you set goals for you, your team, and team members, and what do these goals look like?
As you’ve interviewed candidates, what questions have yielded the right answers for you? I would certainly be delighted to hear your thoughts and your own interview questions. Please share below!

0 Comments

B2B Marketing: How Big Should Your Marketing Database Be?

1/14/2015

0 Comments

 
Picture
How many names—and which names—should you buy for your marketing database?  I wish more marketers would be more strategic, asking themselves questions like these about their data needs. When management is pushing for  more results and faster results, it’s tempting to just pick up the phone and work with the first data provider that comes your way, with minimum or no specs.  But then, you find yourself with loads of data— probably half of which is outside of your target market—but still no data strategy or revenue targets. And you wonder why your conversion rates are so low. If additionally, you invested in a data cleansing tool-—which I highly recommend—you find yourself paying for cleaning and updating useless records.

This kind of shotgun approach to list buying is both rarely effective and very expensive.  But data and analytics do not have to be hard.

A) First, evaluate your data needs properly
  • know what revenue target your marketing team signed up for;
  • know your target geos, industries, company size segments, and personas;
  • know your average outbound conversion rates;
  • then reverse engineer by subtracting your forecasted inbound leads—and “voila”.

B) Next, using your existing database, count only the records that were engaged with you in the last year and whose target segment (geo, industry, company size, personas) matches your own.

The gap between what you need (A) and what you have (B) tells  you (C) how much you need to purchase.

As simple as 1+1 = 2,  Total Data Needs – Existing Relevant Data = Data to Purchase.  


0 Comments

Is your organization measuring customer satisfaction?

6/20/2014

2 Comments

 
Picture


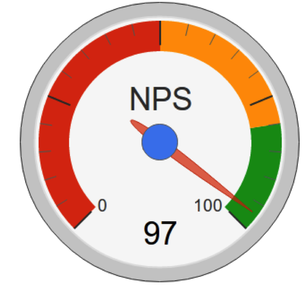
The Net Promoter Score is a key performance metric widely used by organizations across the world to measure the state of customer satisfaction with their products and services. It is based out of answers to a very short and simple survey asking customers if they’d be willing to recommend the company to a friend of a relative. The score is calculating by subtracting the percentage of detractors to the percentage of promoters.


History of the Net Promoter Score

Fred Reichheld is a business strategist who graduated from Harvard Business School in 1978 and has worked at Bain and Company, a strategy consulting firm, ever since. He is known for his published writings on customer loyalty and on what he calls “loyalty marketing.” He co-wrote “The Loyalty Effect: The Hidden Force behind Growth, Profits, and Lasting Value”, published in 2001, as well as “Loyalty Rules: How Today's Leaders Build Lasting Relationships” in 2003.

In studying customer satisfaction and customer experience topics, he became acutely aware of the limitations of traditional customer satisfaction surveys. These surveys are typically lengthy, (taking days or weeks to conduct and process), have low response rates, and have complex statistical algorithms built in that make it impossible for the common man to verify the soundness of the results. By the time these survey answers are processed and results come in, first, it is too late to win back unsatisfied customers, second, the results have so many shade of greys that they are difficult to act upon and don’t create accountability of the front line employees who have the power to impact the ultimate customer experience.

So he enrolled a small team of Bain Consultants on a research project. They set out to find the one survey question that would be a high predictor of future customer behaviors and ultimately company growth, and that could be collected and analyzed quickly. In December 2003 Fred Reichheld published an article in the Harvard Business Review (HBR) called the “The One Number You Need to Grow.” summarizing the findings of the research and where the Net Promoter Score metric and concept got introduced for the first time. He later (in 2006) published a book on the same topic titled “The Ultimate Question: Driving Good Profits and True Growth”. He expanded further on the subject, discerning more of the practical benefits of the metric, in a subsequent HBR article published in 2009 called “Closing the Customer Feedback Loop”. His research was revised and expanded into another book, co-authored with Rob Markey, a Bain partner colleague, that was published in 2011:  “The Ultimate Question 2.0 (Revised and Expanded Edition): How Net Promoter Companies Thrive in a Customer-Driven World.”

Net Promoter Score Pros and Limitations

Net Promoter Score Pros

The brilliancy of the Net Promoter Score is in its simplicity, its high correlation with company growth rates in most industries, its simple and quick calculation (no obscure or complex algorithms), and its accessibility to front-line employees.

Net Promoter Score Limitations

The very high correlation of the Net Promoter Scores with growth rates can be observed in most industries. But, as Fred Reichheld observed in one of his research papers, this correlation becomes weaker when markets are, for example, dominated by monopolies (e.g. Cable) or highly regulated (e.g. utilities in a non-deregulated market). The correlation can also be distorted in industries with a high barrier to entry (i.e. very few competitors), a high switching cost wherein the customer is unhappy but stuck with the company’s product or service or with an addictive product such as cigarettes. Also, one could argue that a company could give away excellent products and services for free and therefore get a NPS score of 100, but that it would not lead to a sustainable and successful business, thereby invalidating the NPS. But that, of course, is a very unlikely scenario.

In conclusion, the Net Promoter Score is an important and significant predictor for the health and growth of a business but it is not the only one.

Other limitations cited are in the different interpretations that can be derived from a given score. For example, if the company has a zero Net Promoter Score , it could mean that all of their customers are passive or that 50% of their customers are promoters while 50% are detractors. But in both cases, the zero score still is a very good early warning sign that the company is not on a trajectory of growth and that something needs to be done.

Another observation is that only customers’ opinions are included in the calculation of a Net Promoter score. Imagining that a company could compute a NPS for each of its product lines and interrupt production of any one of them with an NPS of less than 80, one would still see  the subsequent resulting NPS for the company at higher than 80.(However, that would not be synonymous with growth or a higher market share.)

Critics also point out that segmenting customers in only the three categories of promoters, passives and detractors is highly simplistic and may end up leaving precious information on the table.

Another criticism that often comes up is that non-responders are left out of the equation. Should they be counted as passives or detractors? Should they even be lumped in with responders at all? Nothing is ever perfect and, as a famous statistician once said,  “All models are wrong, some are useful”.

Like every metric or model, the Net Promoter Score has its limitations, but understanding them helps in drawing the right insights from an NPS analysis. Advocates further point to the simplicity and practicality of the metric as outweighing any of its potential weaknesses. 


Read NPS definition here

2 Comments

How to leverage social media data to uncover actionable insights and improve your company’s operations ?

6/17/2014

0 Comments

 
Picture
About 80% of business-relevant information originates in unstructured form – primarily text. Feedback contained in places like social media posts, online reviews, emails, and survey verbatims contain insights that go beyond a score or 5-star rating. They provide the texture and insight a business needs to understand “Why” a customer likes or dislikes any part of the customer experience.

Text Analytics allows companies to uncover countless issues, opinions, and opportunities that would traditionally be buried in pages and pages of text data. Text Analytics allow to uncover emerging issue trends before they balloon into giant problems and capitalize on opportunities that could otherwise be missed.

“Precision” and “Recall” are the two high level and common metrics used to measure text analytics software performance.

Precision is the proportion of comments that were correctly categorized into a given topic. For example, if a topic analysis system identifies 100 references to the topic “staff attitude” and 90 of the identifications are correct, then precision for this topic is 90%.

Recall measures the completeness of your Text Analytics system. If there are actually 120 true references to a topic “staff attitude,” for example, then the system recall for this topic is 75% (90/120.)

Read full post here

0 Comments

Are Bitcoins Too Good To Be True?

2/13/2014

0 Comments

 
Picture


The controversies that swirl around Bitcoin often obscure one of the most significant technical breakthroughs of the crypto currency: the ability to transfer cash instantly without having to share bank account information with the receiving party.

Secure: No Exchange Of Bank Account Information

Technically speaking, transacting Bitcoins over the peer-to-peer network is incomparably safer than sharing your credit card information over the phone, email, internet, leaving your credit card in a plastic folder at a restaurant, or handing it over to random clerks or sales reps multiple times a day. Bitcoin relies on the most advanced cryptographic algorithm to date. The resulting gain in security far outweighs money-laundering concerns. In addition, as recent Bitcoin-related arrests attest, not having to exchange your account information with the receiving party (and vice versa) doesn’t mean your transactions are invisible. And as Overstock CEO Patrick Byrne eloquently pointed out, the favorite currency of criminals still remains the green paper dollar, and yet, for all of that, the greenback is not less viable as a mainstream currency.

Analogous to our railway or power grid, the U.S. credit card and payment system has been rendered obsolete and inefficient by decades of underinvestment in technology innovation. Despite being one of the largest payment markets in the planet, the U.S. payment market is probably one of the least secure. Most major markets switched over 20 years ago to the microchip card system, where one’s secret pin number is requested and required upon each transaction. The reason why U.S. credit card companies haven’t made the switch yet? Cost. Upgrading every card and every payment terminal with patented technology would hurt the bottom lines. But as the latest massive hacks to Target, Neimann Marcus, etc. have shown the public, the U.S. payment system is in dire need of an upgrade.

Enter Bitcoin, with the potential to disrupt an unwieldy and antiquated status quo. Equipping retailers and consumers with bitcoin accounts would potentially need no infrastructure upgrade. In that respect, Bitcoin is the epitome of a disruptive technology: it’s currently imperfect—for all the issues that have already been mentioned in the press—but it does the job of transferring money from one party to another better: faster, more securely, and cheaper.

Fast: Almost Instant Transfer

Have you noticed it always takes three business days via traditional media, like wire transfer or ACH, for money to change “hands”? It’s no secret that the ‘holding period’ is a key income stream for financial institutions. This time window is supposed to protect against fraud but with the speed of today’s electronic communication it hardly takes 3 days to figure out that the emitting party does not, for example, have the cash required for transfer. So while there is some transfer risk, the bank is profiting by holding your cash a little longer than strictly needed. A Bitcoin transaction, however, takes about ten minutes.  That said, until there is more liquidity in the Bitcoin market, the conversion back to dollars could take a little longer.

Good: Digital Currency Will Help The Poor Says Bill Gates

Bill Gates, at an “Ask me Anything” Reddit session, shared his belief than “Over the next five years...digital money will catch on in India and parts of Africa and help the poorest a lot.” He used Kenya as an example, where almost half the transactions are executed with M-pesa, a mobile phone based money transfer and microfinancing service offered by Kenyan leading telecom carriers. In countries with weak financial systems and structures, a self-regulating, decentralized system, with low transactional fees holds enormous appeal.

In some ways, this is a repeat of the huge success of cell phones in Africa. Many countries in Africa were early mass adopters of cellular technology. Cell phones may jar with most people’s perceptions of the continent, but their success was inevitable on a continent where landline infrastructure was unreliable, network penetration outside the cities was weak, and copper-wire theft was endemic. Installing a few cellular base stations was cheaper, and easier to maintain – and brought millions into the modern economy.

Maintaining a functioning and reliable financial system is complex and expensive, and the cost is ultimately borne by the ‘bankable’ consumer. But not everyone is ‘bankable’. According to the World Bank, half of the adult population of the world does not own a bank account. In the U.S., one in every nine households has no checking account. Reasons vary: from not enough money to open and keep the minimum cash balance required by most banks, to not having the administrative paperwork or identification required, to physical distance from a bank branch, and so on. However, the cost of a transaction for people outside of the traditional banking system can be exorbitant: in the U.S., check cashing services can have fees of about 2%, and money orders can be upward of $1 a piece. In contrast, Bitcoins can be sent securely via SMS for free. Despite Bitcoin’s hi-tech nature, the benefits of a decentralized peer-to-peer digital cryptographic currency might be felt most among the financially and socially marginalized.

Cost-Effective: More Economical Than Credit Cards For Both Small Businesses And Large Merchants

The United States’ addiction to credit is expensive. The 2-3% swipe fees retailers have to pay to credit card companies are being passed on to the consumer as that cost is folded into retailer pricing. Fifty-three percent of general purpose card payments were done using a credit card in 2012 (by dollar value) according to the 2013 Federal Reserve Payment study, i.e. on average retailers have to increase their sales price by about 1.5% to offset credit card fees. Some low cost retailers (e.g. Aldi) don’t accept credit cards for just that reason: to ensure the consumer that they’re getting their best everyday low prices. Margin in the grocery business is so low that 1.5% makes a big difference.

So Overstock CEO Patrick Byrne's position is hardly surprising. Partnering with Coinbase costs the retail giant only 1% on conversion fees back to U.S. dollars, a major savings in comparison with the 2-3% transaction fees of credit card companies. Only a debit card transaction might beat that rate. And the bitcoin transfer is secure. Average online fraud rates hover around 1% of total online sales in the U.S. We’re not even looking at the number of people abandoning their online shopping cart because their banks blocked their credit card on suspicion of fraudulent activity. Any dent in this number would be good news for retailers. So, adding bitcoin as a means of payment is more than a marketing move, it’s an financial move. As for now, Coinbase does not offer Bitcoin loans, so for people who like to spend more than they can afford, credit cards still remain the answer. Though bitcoin loans don’t require a big of stretch of the imagination, with the currency gaining more stability, and with a peer-to-peer network vs. a government controlled central bank deciding a base rate, the Bitcoin network would probably be able to provide more market-based, competitive rates to merchants and consumers than credit card companies would be able to offer.

As for the pseudonymous Satoshi Nakamoto who wrote the Bitcoin white paper and vanished, taking with him billions of dollars worth of bitcoins that he mined? We are all jealous, but, hey, he compensated himself for his invention and let the world use it for free.

Bitcoin Adoption

Bitcoin viability relies on a sizable adoption rate of the currency by consumers and retailers, as well as on getting regulators and the financial community on board. Key to Bitcoin success will be the ability of the early adopters and visionaries to educate the rest of us—consumers, merchants and the financial community—to correct some of the misconceptions and alleviate some of the concerns.

Another key to Bitcoin success will be the willingness and ability of all the Bitcoin-based businesses to work closely through organizations like Bitcoin.org. As some regulatory missteps or fraudulent activities have shown, the industry will only be as strong as its weakest link.

The VC community has been successful in the past in navigating choppy regulatory waters and influencing key stakeholders.  Paypal, AirBnB, and Uber are just a few examples of successful start-ups that have been able to make room for their innovation within the regulation framework. Time will tell if the Bitcoin community is able to carve out a place for this elegant technology in the cutthroat, free-for-all world of international finance.

Thanks for reading my post this far. Please leave your comments below, I’d love to read your feedbacks and learn more from all of you.


0 Comments

Promoting your products using Google Product Listing Ads could be a good use of your advertising dollars

2/3/2014

0 Comments

 
Picture
Google introduced Product Listings Ads (PLAs) in the US in October 2012. A month later PLA click-through-rates (CTRs) had already surpassed Google standard text search ad CTRs according to a Marin Software report released in August 2013, reflecting shoppers’ preference for this richer, more visual search result — a PLA includes product picture and price information—. The PLA CTR kept its upward trend since then, as shoppers became more familiar with the Google new search feature. A Marin Software report released in January 2014 shows PLA CTR growing 6% from January 2013 to December 2013 with a peak during shopping season, while Google standard text ad CTR experienced a 13% drop during the same period. According to IgnitionOne Inc. PLAs CTR were about 47% higher than standard Google pay-per-click text ads last year.

This shopper preference was not lost on retailers who started to shift their search advertising dollars to PLAs, which also initially happened to have lower cost-per-clicks (CPCs). As a result PLA CPCs increased dramatically, by an astounding 141% from January to December 2013 according to this same Marin Software report. This cost increase might lead retailers to rethink and refine their search marketing spend strategy. The Marin Software report highlights for retailers an opportunity in smartphones, where PLA CPCs have remained lower than their desktop and tablet counterparts, despite higher PLA CTRs.

The Marketing Charts article below provides additional insights to retailers. According to Adobe, retailers achieved a somewhat steady ROI on their PLAs despite the increased CPC: a ROI that averaged to about $9 for every dollar spent on PLA according to Kenshoo. Also according to Adobe, Google PLAs would already drive more traffic than Yahoo or Bing paid search, only a little over a year after its introduction. 

~~~~~~~~~~~~~~~~~~~~~~~~~~~~~~~~~~~~~~~~~~~~~~~~~
As Demand Grows, Retailers Said to Generate More Paid Clicks From PLAs Than Yahoo Bing

By MarketingCharts Staff
31/01/2014
MarketingCharts.com

Cost-per-click for Google product listing ads (PLAs) jumped by 80% year-over-year during Q4 2013, all the while maintaining a relatively steady ROI, according to an Adobe Digital Index analysis of almost 7 billion paid clicks. It’s the latest data set to show a rapid rise for PLAs, which Adobe says now generate more paid search clicks than Yahoo Bing for some retailers.

According to Adobe, retailers who use PLAs and standard text ads saw roughly 22% of their paid search clicks come from PLAs during the Q4 2012-Q4 2013 period, edging the share seen from Yahoo Bing (20%). (Standard Google text ads generated the remaining 58%.)

Here are some Q4 2013 PLA highlights from recent studies concerning paid search:
  • According to IgnitionOne, US advertisers who used PLAs increased their Q4 2013 spending by a massive 618% year-over-year (with that high growth likely due to a small base to begin with). CTRs for product listing ads outperformed comparable rates for PPC ads for the duration of the quarter.
  • Kenshoo’s retail clients upped their spending on product listing ads by 138% year-over-year in Q4, achieving a return of $8.84 for every dollar spent

Read full article here

0 Comments

Grainger digital commerce strategy

11/24/2013

5 Comments

 
Picture
B2B customers also are B2C customers in other areas of their lives, and have grown accustomed to researching, finding, and purchasing what they need online. It seems only natural, then, that they transfer their online behaviors to the workplace. See my related blog post on March 2013. B2B organizations slow at embracing this reality incur the huge risk of gradually being wiped out by their competition or by Amazonsupply.com once the latter widens its product selection to your industry and company’s line of business.

What stands in the way of e-commerce for B2B players is often its sales team. Some sales teams see e-commerce and self service functionalities as a direct threat to their value add when, in fact, e-commerce will only increase volume and speed of transactions, and provide sales team with tons of data and insights into their client accounts. See Grainger’s powerful example below.

Pricing is another roadblock to e-commerce adoption by B2B organizations. Many don’t have readily available prices, because it might involve a lengthy assessment of customer needs, deal structuring, and negotiation. However, there are many ways the e-commerce site can address that, such as make available standard ”off-the –shelf” products or services, provide a price range, ask the client to  “request a quote,” and provide some necessary inputs for that quote, etc. The sales team can then pick up the conversation from there. In the end, the e-commerce site simply increases the volume of prospects, and opportunities for the sales team that can, then, spend more time closing deals than sourcing deals.

Grainger is a great and successful example of B2B digital commerce. It started its e-journey in 2000 and invested a significant amount of resources since then. Today, a third of its transactions come from its e-commerce site, and 14% of its traffic comes from mobile devices.

If, as a B2B company, you haven’t started to think about your e/m-strategy, it’s never too late!

~~~~~~~~~~~~~~~~~~~~~~~~~~~~~~~~~~~~~~~~~~~~~~~~~~~~~~~~~~~~~~~~~~~
Grainger unveils a new B2B e-commerce platform and iPad app
An Internet Retailer exclusive details the B2B retailer’s plans.

By Amy Dusto
Internet Retailer
11/18/2013

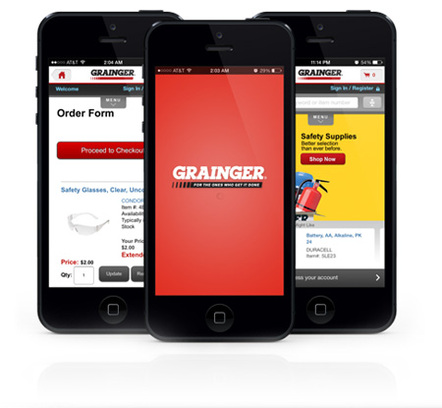
W.W. Grainger Inc. tomorrow will complete a migration, several months in the making, of the majority its customers to a new e-commerce platform, the B2B retailer of maintenance, repair and other products exclusively tells Internet Retailer. With updated navigation and order management tools, the platform, designed for Grainger’s corporate clients, allows up to 1,500 staffers to log into a single business account and place, approve or track orders via the web or with one of Grainger’s mobile commerce sites or apps, the merchant says. Helping to foster the platform’s utility across devices, Grainger tomorrow also will unveil a new iPad app.

(…)

Customers that use Grainger’s mobile sites and apps approve orders 40% faster on average than those who don’t, Robertson says. Additionally, one in five Grainger orders placed on a mobile device are picked up in one of the retailer’s 360 U.S. branches, which is significantly higher than the number of web orders picked up in stores, he says.

(….)

The retailer built the iPad app in-house after analytics revealed that many customers were trying to use its iPhone app or access the mobile site on their iPads, says Michael Cooney, senior product manager for mobile. Mobile apps have almost a 9% higher conversion rate than the m-commerce web site for Grainger, and shoppers come back to apps more often, he says. Overall, 14% of Grainger’s traffic now comes from mobile devices, a number that continues to grow. In response, the retailer is increasingly adopting a “mobile-first” approach to future web developments, he says.

Online retail is also growing for Grainger. Today, one-third of its sales come from the web, and the retailer predicts web orders will account for 40% or 50% of total sales within the next few years, says Paul Miller, vice president of global e-commerce.

(…)

On top of those sales, customers are increasingly starting their product searches on Google Inc.’s search engine and turning to social media for buying suggestions, both of which indirectly influence sales both online and offline, Miller adds.

Accordingly, Grainger has expanded the number of paid search keywords it manages from less than 10,000 in 2010 to more than 5 million today, he says.

(…)

The retailer’s significant e-commerce and m-commerce updates come after it opened in May an e-commerce headquarters in downtown Chicago. Grainger decided to add a city office rather than rely on its headquarters 30 miles north, in Lake Forest, IL, mainly to attract and have better access to the developers, Miller says.

Read full article here

5 Comments

Google Remains Number 1 In Mobile Advertising Market Share, Facebook Sees Big Gains, But Where Is Linkedin?

9/2/2013

0 Comments

 
Picture
Either LinkedIn is doing it wrong, or there is a lot of educating to do to get B2B marketers to use social media and other digital channels for advertising, or both.

In this study from eMarketer, Google is expected to capture 53% of market share in mobile advertising (vs. 33% of market share across all devices), and Facebook 15% of market share in mobile advertising (vs. only 5% of market share across all devices) in 2013. Kudos to Facebook, who is quickly catching up despite a slow start in the mobile arena. But Yahoo! and LinkedIn are not even in the mobile advertising picture! Yahoo still clings on its 3% of market share of the desktop web ad revenue, but better hurries on the mobile front, if it does not want to disappear from the advertising world altogether.

LinkedIn could be the perfect platform for B2B advertising, yet their advertising engine still hasn’t fired up. There are two factors at play here. First, LinkedIn has a lot of work to do to come up with good, standard advertising and marketing products that can be easily replicated for various industries and B2B marketers. Second, the B2B marketer still relies heavily on trade shows, white papers, webinars, i.e. traditional B2B marketing channels, and is slow in adopting newer forms of the digital medium.

~~~~~~~~~~~~~~~~~~~~~~~~~~~~~~~~~~~~~~~~~~~~~~~~~~~~~~~~~~~~~~~~
Facebook Sees Big Gains in Global Mobile Ad Market Share
Google to take home half of $16.65 billion worldwide mobile ad market

eMarketer
08/28/2013

Facebook’s continued emphasis on mobile monetization, along with its users’ ongoing shift toward mobile devices, is resulting in dramatic gains in mobile ad market share, according to eMarketer’s latest estimates of worldwide ad spending and revenues at significant players in the mobile and digital ad markets.

The company is expected to see its share of global mobile internet ad revenues reach 15.8% this year, up from just 5.35% in 2012, which was the first year that Facebook had any mobile ad offerings. eMarketer previously estimated Facebook’s share of mobile ad revenues worldwide would reach 12.9% this year.

eMarketer estimates that Google will grab 53.17% of the worldwide mobile ad market this year, up slightly over 2012—primarily a result of continued growth in mobile search usage and further mobile monetization of YouTube. The overall mobile ad market worldwide is expected to grow 89% to $16.65 billion in 2013, eMarketer estimates.

Both Facebook and Google are now the top ad publishers not only for mobile, but for all digital as well—with an even stronger lead on the competition.

Across all devices, Google remains by far the No. 1 digital ad publisher in the world and will take in nearly 33% of all digital ad dollars worldwide this year, eMarketer estimates, up from 31.46% in 2012. Facebook will also increase its share of the total, to 5.41%, while Yahoo! will lose some ground. Microsoft’s share of the worldwide market will hold steady.

Read full article here

0 Comments

Mobile Advertising

5/10/2013

0 Comments

 
Picture
There is no doubt about it; you need a technically savvy marketing team who understands user experience and all of the functionalities a mobile platform can offer. Essentially, having marketers with a product management skillset on your team can get you ahead of the game when it comes to producing great mobile advertising campaigns.

My favorite mobile ad campaign remains Germany’s BMW snow tire one during the winter of 2008.  On the first snowy day, BMW simply sent a personalized MMS to the customers who had bought one of their cars that past summer. Each customer would see a picture of the exact model —including color— of the car they had purchased along with the set of snow tires recommended for that specific model and the associated price. This $60K ad campaign totaled $45M of revenue. Unbeatable!

What made this campaign so good? It was relevant: timely—appearing on the day they suddenly should be thinking about snow tires; specific—helping consumers decide which, among zillions of tires, they needed; helpful—thereby saving the customer tons of time; and included an easy call to action—customers were able to just call or buy online.

This was possible because BMW had good data on its customers. All the technology in the world can’t make up for a company’s poor data hygiene and governance. Because good customer data is key for effective marketing, companies must pay particular attention to their data, and be willing to allocate the necessary resources on it. Marketing teams are best served with data lovers in their teams and a very close partnership with their IT and data teams.


~~~~~~~~~~~~~~~~~~~~~~~~~~~~~~~~~~~~~~~~~~~~~~~~~~~~~~~~~~~~~~~~~~~
Why the best mobile ad campaigns start with technology, not creative

By Mahi de Silva
VentureBeat
05/06/2013

Last month at international ad festival Cannes Lions, one of the most closely watched areas was the mobile category, where this year there were over 1,000 entries. As the judges noted, winning ad campaigns combined creativity, idea, execution, and relevance in a way that could only be achieved through the mobile platform. The emphasis was on portability, connectivity and pervasiveness – in other words, campaigns that were mobile at their very core.
Why is this important? Because for the first time, a coveted win at this exclusive festival was less about the creative – the emotional effect of the “art” on the consumer – and more about the technology. A win in the mobile category meant the agency had to ditch the idea of creative concept first and start thinking platform first. In a way, it’s the last shovelful of dirt being thrown onto the grave of the Mad Men era.

Cannes is by no means a measure of which campaigns are the most effective. Unlike many digital awards, there is little to no emphasis on metrics or results. But most of the winning mobile campaigns were highly effective. Why? Because they integrated mobile technology into the user experience.

What is mobile technology?
Mobile technology is enabled through device-specific hardware like GPS, the accelerometer, the gyroscope, camera, microphone, and the natural gesture-based navigation. But it’s also the software: calendar, maps, photo filters, QR readers, web access, weather, e-commerce, and social media sharing. And let’s not forget the antiquated click-to-call or phone call feature.

We just named about a dozen unique, interactive elements that have never before been available to marketers in one package. Print, television, desktop, even out-of-home digital display and POS advertising pale in comparison to what mobile offers. It is by far the most exciting and most powerful medium for anyone looking to capture the attention of a consumer audience.

The trick, however, is finding the right combination of technology for each campaign, and then coming up with the artful and engaging creative to match.

The creative challenge
When thinking platform-first instead of concept-first, creative teams have to be able to imagine the utility of the campaign to the user, not the impression. They have to put function before form, which can be a challenge to the average agency creative.


Read full article here

0 Comments

Using a B2B market place

4/13/2013

0 Comments

 
Picture
If you’re a B2B business and don’t have the capital, resources, know how, or risk appetite: this is a great way to start your e-commerce journey !


~~~~~~~~~~~~~~~~~~~~~~~~~~~~~~~~~~~~~~~~~~~~~~~~~~~~~~~~~~~~~~~~~
B&H Photo sharpens its focus on b2b sales
Online b2b sales have surged since joining the Ariba Discovery portal.

By Paul Demery
Internet Retailer
04/09/2013

When e-retailer B&H Photo, Video and Pro Audio decided to focus on selling to other businesses a few years ago, the retailer asked some of its customers for advice on how to grow its b2b sales. Taking their advice, B&H started contacting buyers though an online b2b network and within the past two years has grown online b2b sales by more than 100%, says Barry Eisenberg, manager of business development, contracts and procurement.

B&H, No. 165 in the Internet Retailer Top 500, still does most of its sales to consumers, topping $100 million in 2011. It sells some 300,000 consumer electronics products, ranging from professional-grade cameras and audio equipment to personal computers, studio lighting equipment and binoculars.

But after setting up a profile on Ariba Discovery in the second half of 2011, B&H quickly added “hundreds of thousands” in new b2b sales by lining up interested buyers, Eisenberg says. He declines to specify B&H’s total b2b sales. Ariba Discovery is a business-matching service delivered on the Ariba Network, a b2b trading network used by nearly 1 million buyers and sellers to connect and collaborate.

In the past B&H had prospected for b2b customers mostly through mailing or e-mailing thousands of pitches to potential buyers on industry lists. But it would take hours of staff time to sift through replies to find and match buyers with the right products.

Today a dedicated staff spends about 20 minutes each day viewing up to about 10 customer leads in Ariba Discovery, where potential customers can view B&H’s profile with its full product catalog. B&H staff can respond within minutes through the portal to prospects requesting more information, Eisenberg says.

Although 10 prospects a day might not sound like a lot, in the b2b world it can quickly add up to a large new source of sales from steady repeat customers dealing in high volumes, he says. 

Read full article here

0 Comments
<<Previous
    View my profile on LinkedIn

    Categories

    All
    Digital Marketing & E Commerce
    Digital Technology
    Sustainability

    Archives

    January 2016
    December 2015
    May 2015
    January 2015
    December 2014
    June 2014
    February 2014
    January 2014
    November 2013
    September 2013
    August 2013
    May 2013
    April 2013
    March 2013
    February 2013
    January 2013
    August 2011
    July 2011
    January 2011

    RSS Feed